Core effectiveness improvement in
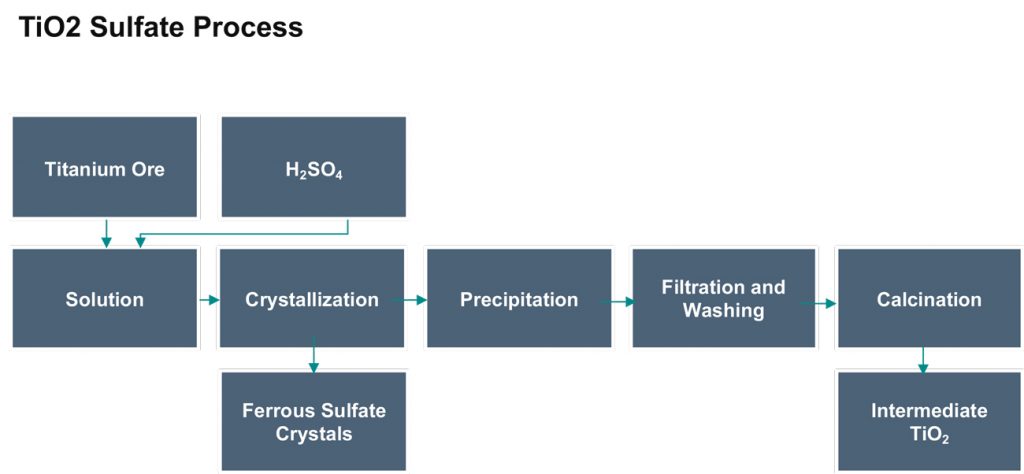
The chemical company was a medium-sized producer of titanium dioxide pigments (“TiO2”). Its two plants with an annual combined capacity of 130,000 metric tons were experiencing low productivity. Market demand was high. TiO2 manufacturing was based on the sulfate process, and was highly automated. The sulfate process is a batch chemical process that uses sulfuric acid to extract TiO2. Once an intermediate TiO2 pigment has been produced by the sulfate process, it is ‘finished’ into products with specific performance characteristics. The company produced over 20 grades of TiO2, which provide a variety of performance properties to meet customers’ specific requirements.
Management had tried various productivity improvements, including improved procurement of feedstock, adjusting product mix across plants, and adjusting price levels. Despite these measures, it could not resolve the low financial performance or identify other potential actions to take.
Reduced production fluctuations through preventive maintenance to achieve the following results
- Improved capacity utilization from 0.80 to 0.92
- Increased production by more than 15,000 metric tons
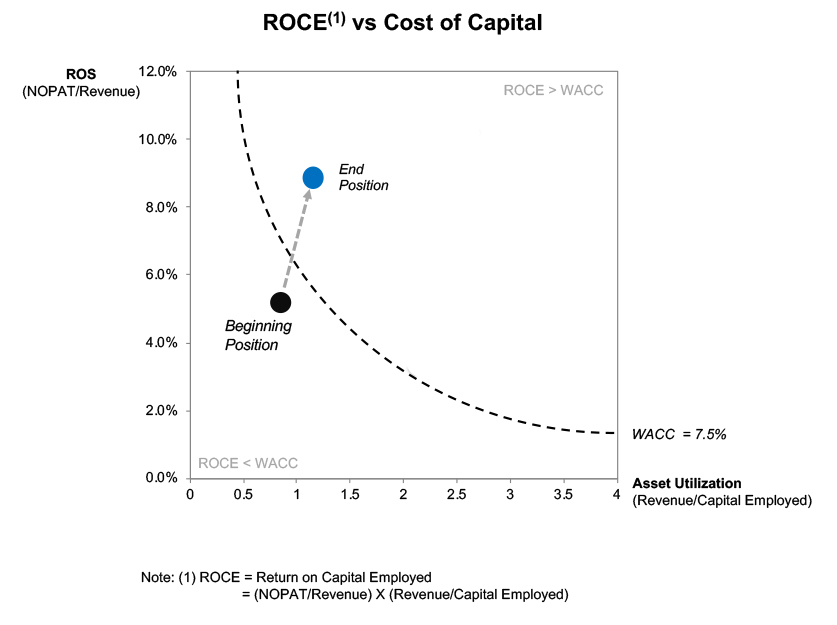
- Increased revenue from $211m to $243m
- Improved NOPAT by roughly $10m (4.8% to 8.8%)
– eliminated loss due to unscheduled shutdowns
– reduced inventory carrying costs
– improved purchasing costs of raw materials - Increased Revenue/Capital Employed from 0.94 to 1.16
– reduced FG and WIP safety stock - Improved Return on Capital Employed from 4.5% to 10.2%
1. Performed a comprehensive analysis of the plants, including
- process flow
- capital cost
- operating cost
- capacity utilization
Preliminary findings revealed large fluctuations in plant capacity utilization.
2. Examined plant slowdowns and found frequent instances of the following
- repairs
- production bottlenecks
- irregular speed of production
- excess quantity-size limits
- slow ramp-up times
Found that these factors contributed to
- low plant performance
- a high build-up of WIP inventory
- the uneven quality of product
- high cost of electricity consumption
3. Analyzed production and maintenance schedules and identified the following
- production targeted 95% capacity utilization, but was achieving 78%
- maintenance was conducted reactively to repair unscheduled events
- upon resuming production, managers would use excess speed to catch up to target capacity utilization, creating more imbalances in production
4. Worked with the company’s Production and Maintenance functions to reduce unscheduled shutdowns and reduce the associated costs by installing a preventive maintenance program
5. Conducted a pilot program for testing at the smaller plant (30,000 metric tons), including
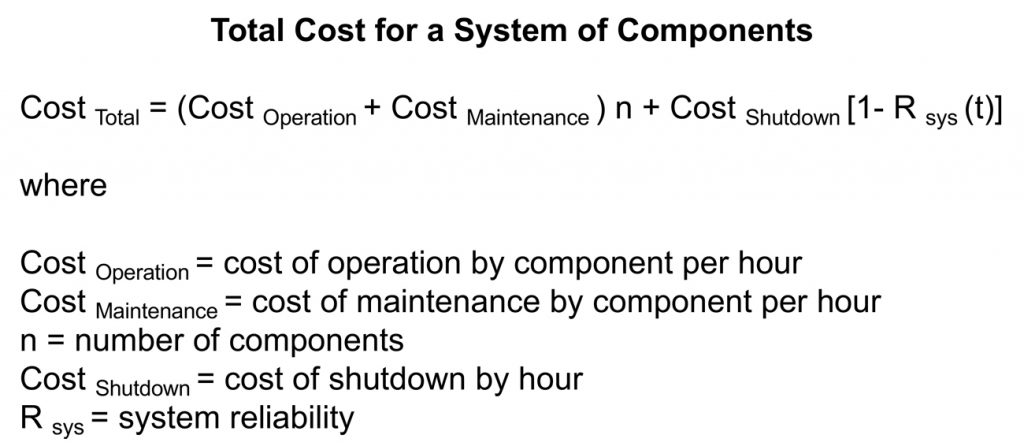
- translation of the operating plant model into a plant reliability model
- probabilistic assessment of critical components
- measures of cost and reliability by component and plant system
- calculation of overall plant reliability (bottom up)
- identification of problematic components and systems
- evaluation of each measure of preventive maintenance based on two contributions
- reliability of the overall plant
- total cost
6. Optimized achievable capacity utilization targets
7. Upon successful results, designed project for execution of a preventive maintenance program at the large plant (100,000 metric tons).
8. Negotiated a price reduction of 5% on materials